GSP240

Overview
There are many tools out there for data scientists to analyze big data, but which of those tools can help you explain and justify your analysis to management and stakeholders? Raw numbers on paper or in a database will hardly do. This Google Apps Script lab leverages two Google developer platforms, Workspace and Google Cloud, to help you complete that final mile.
With Google Cloud developer tools, you can gather and crunch your data, then generate a slide and spreadsheet presentation to blow away management and stakeholders with your breathtaking analysis and insightful takeaways.
This lab covers Google Cloud's BigQuery API (as an Apps Script advanced service) and the built-in Apps Script services for Google Sheets and Google Slides.
The lab also sets up a scenario that closely resembles real life. The app used showcases features and APIs from across Google Cloud. The goal is to demonstrate how you can leverage both Google Cloud and Workspace to solve challenging problems for your organization or your customers.
What you'll learn
- How to use Google Apps Script with multiple Google services
- How to use BigQuery to perform a big data analysis
- How to create a Google Sheet and populate data into it, as well as how to create a chart with spreadsheet data
- How to transfer the spreadsheet chart and data into separate slides of a Google Slides presentation
Setup
Before you click the Start Lab button
Read these instructions. Labs are timed and you cannot pause them. The timer, which starts when you click Start Lab, shows how long Google Cloud resources will be made available to you.
This hands-on lab lets you do the lab activities yourself in a real cloud environment, not in a simulation or demo environment. It does so by giving you new, temporary credentials that you use to sign in and access Google Cloud for the duration of the lab.
To complete this lab, you need:
- Access to a standard internet browser (Chrome browser recommended).
Note: Use an Incognito or private browser window to run this lab. This prevents any conflicts between your personal account and the Student account, which may cause extra charges incurred to your personal account.
- Time to complete the lab---remember, once you start, you cannot pause a lab.
Note: If you already have your own personal Google Cloud account or project, do not use it for this lab to avoid extra charges to your account.
Introduction
Google Apps Script and BigQuery
Google Apps Script is a Workspace development platform that operates at a higher-level than if you use Google REST APIs. It is a serverless development and application hosting environment that's accessible to a large range of developer skill levels. In one sentence, "Apps Script is a serverless JavaScript runtime for Workspace automation, extension, and integration."
It is server-side JavaScript, similar to Node.js, but focuses on tight integration with Workspace and other Google services rather than fast asynchronous event-driven application hosting. It also features a development environment that may be completely different from what you're used to. With Apps Script, you:
- Develop in a browser-based code editor but can choose to develop locally if using clasp, the command-line deployment tool for Apps Script
- Code in a specialized version of JavaScript customized to access Workspace, and other Google or external services (via the Apps Script URLfetch or Jdbc services)
- Avoid writing authorization code because Apps Script handles it for you
- Do not have to host your app—it lives and runs on Google servers in the cloud
Note: For more information about Apps Script, refer to the official documentation, which features an overview with quickstarts, tutorials, and videos as well.
Apps Script interfaces with other Google technologies in two different ways:
- Built-in service
- Advanced service
A built-in service provides high-level methods that you can use to access Workspace or Google product data, or other useful utility methods. An advanced service is merely a thin wrapper around a Workspace or Google REST API. Advanced services provide full coverage of the REST API and can often do more than the built-in services, but require more code complexity (while still being easier to use than the REST API itself).
Advanced services must also be enabled for a script project prior to using them. When possible, a built-in service is preferable because they're easier to use and do more heavy-lifting than advanced services. However, some Google APIs don't have built-in services, so an advanced service may be the only option. BigQuery is one example of this; No built-in service is available, but a BigQuery advanced service does exist. (Better than no service, right?)
Note: If you're new to BigQuery, it's a Google Cloud service you use to perform simple (or complex) queries on very large data corpuses, say on the order of multiple terabytes, yet still can provide results in seconds, not hours or days.
Accessing Google Sheets & Slides from Apps Script
BigQuery is only available as an Apps Script advanced service. However, both Google Sheets and Slides have built-in Apps Script services as well as advanced services, for example, to access features only found in the API and not available built-in. Whenever possible, choose a built-in service over an advanced equivalent as the built-in service provides higher-level constructs and convenience calls, which simplifies development.
Note: For a review before jumping into the code, see Sheets service as well as the Slides service.
Task 1. Query BigQuery and log results to Sheet
You're going to take a big bite out of this lab with this first task. Once you finish this section, you'll be about halfway done with the entire lab.
In this section you'll perform the following:
- Start a new Google Apps Script project
- Enable access to the BigQuery advanced service
- Go to the development editor and enter the application source code
- Go through the app authorization process (OAuth2)
- Run the application which sends a request to BigQuery
- View a brand new Google Sheet created with the results from BigQuery
Create a new Apps Script project
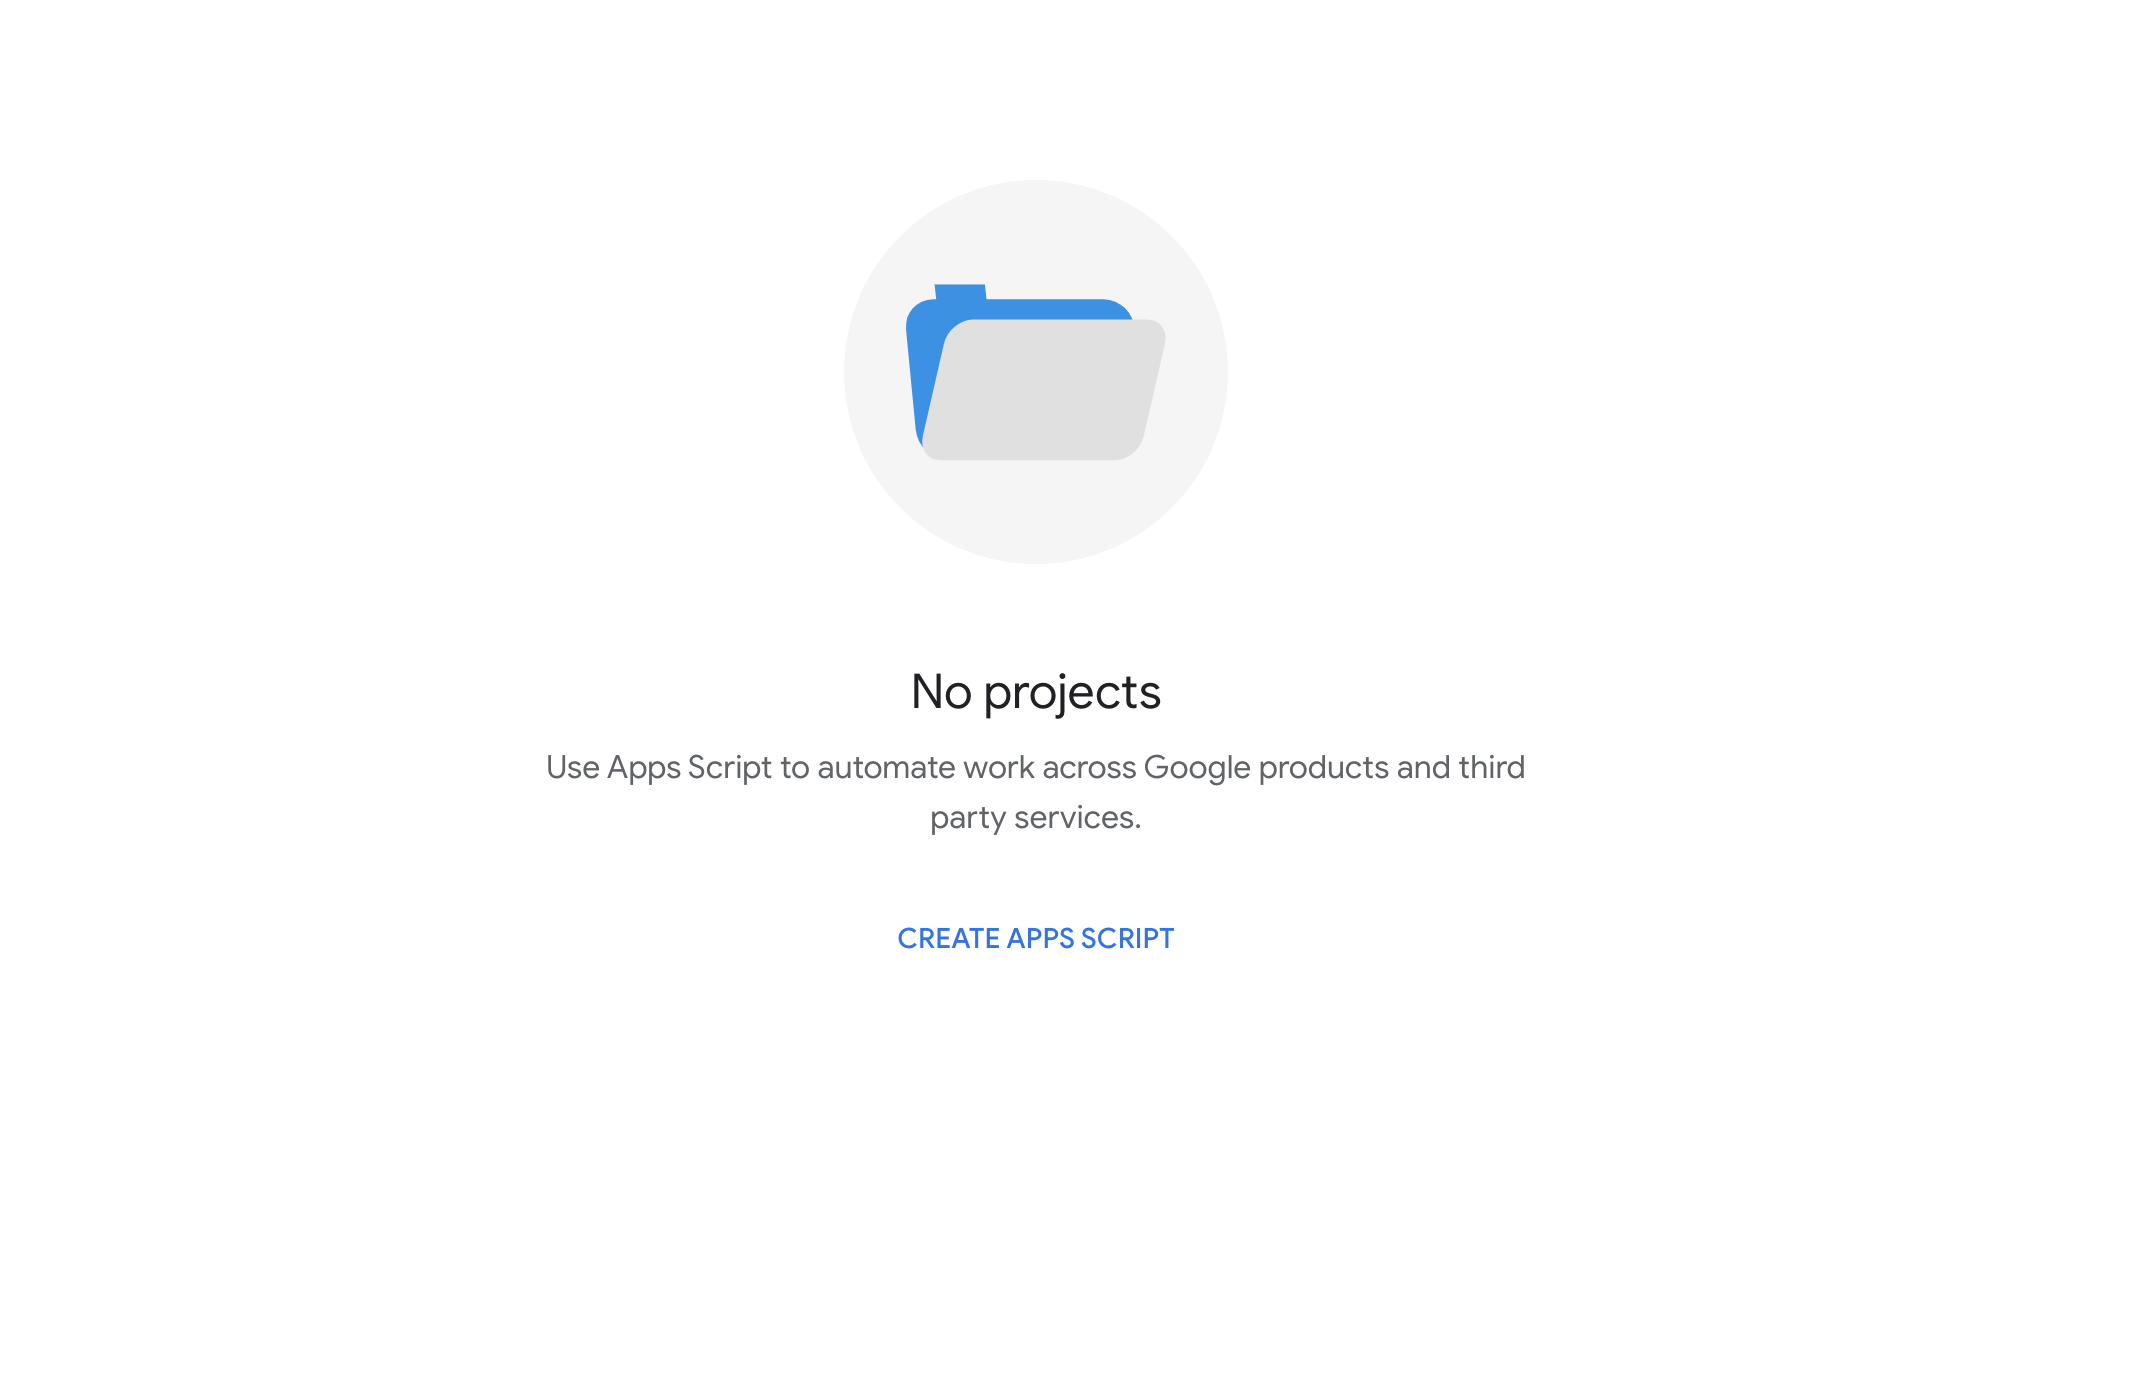
- Create a new Apps Script project by going to script.google.com. For this lab, click the Create Apps Script link.
- The Apps Script code editor opens:
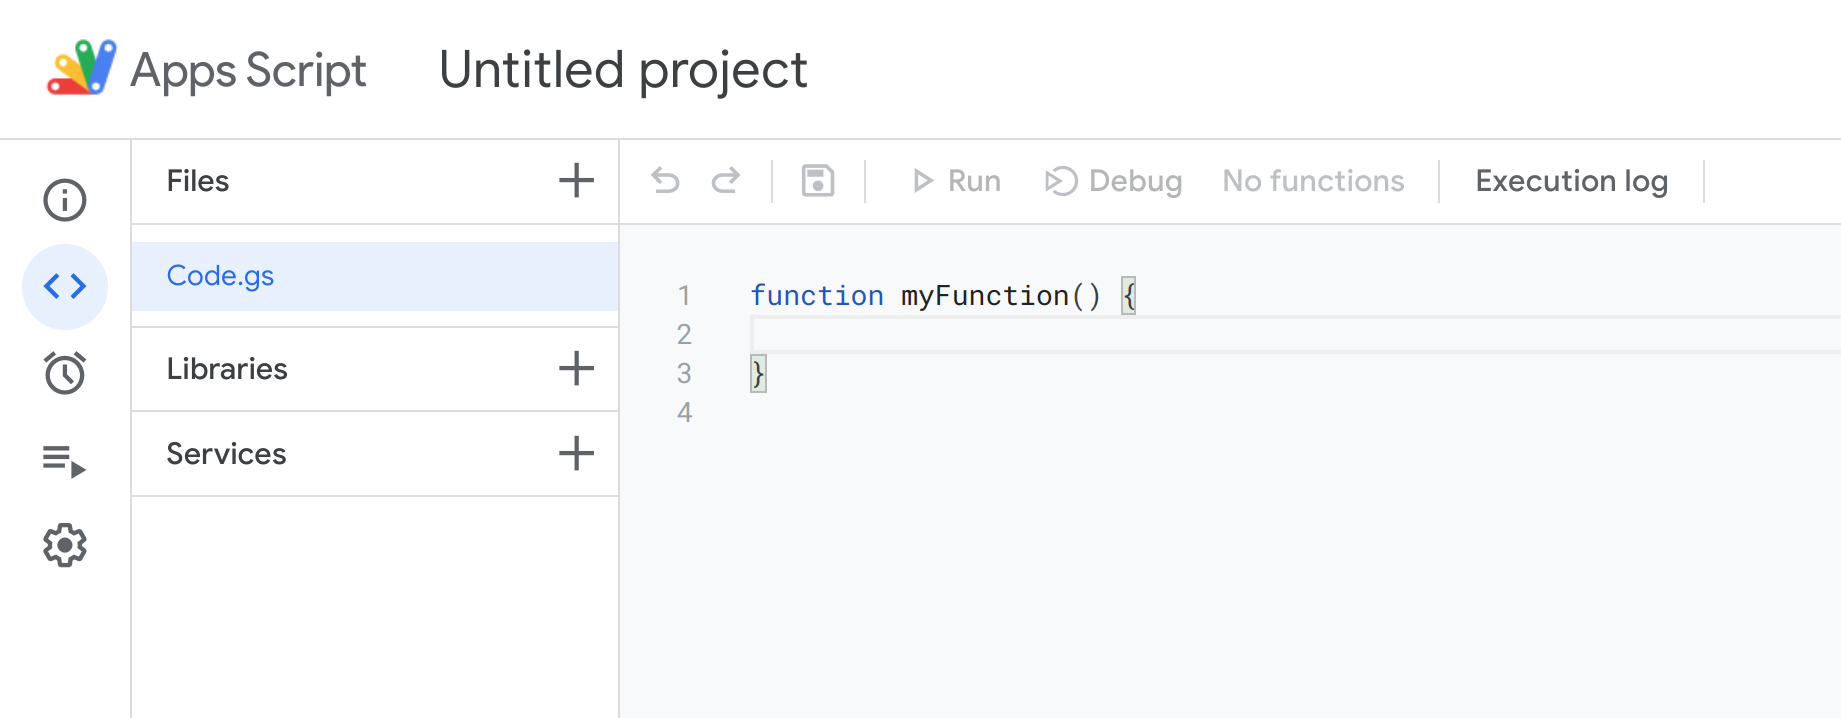
-
Name your project by clicking the project name at the top ("Untitled project" in the figure above).
-
In the Rename Project dialog, name the project as per your choice (for example: "BigQuery", "Sheets", "Slides demo", etc) and then click Rename.
Enable the BigQuery advanced service
Enable the BigQuery advanced service for your new project and enable the BigQuery API.
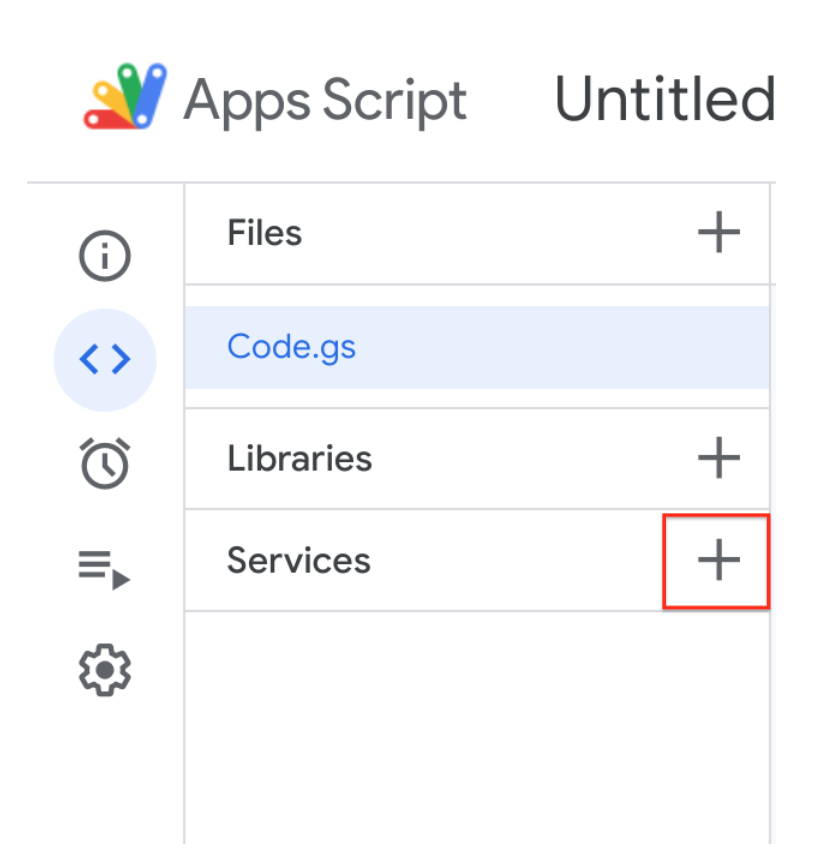
- Click on the Add a service icon adjacent to Services.
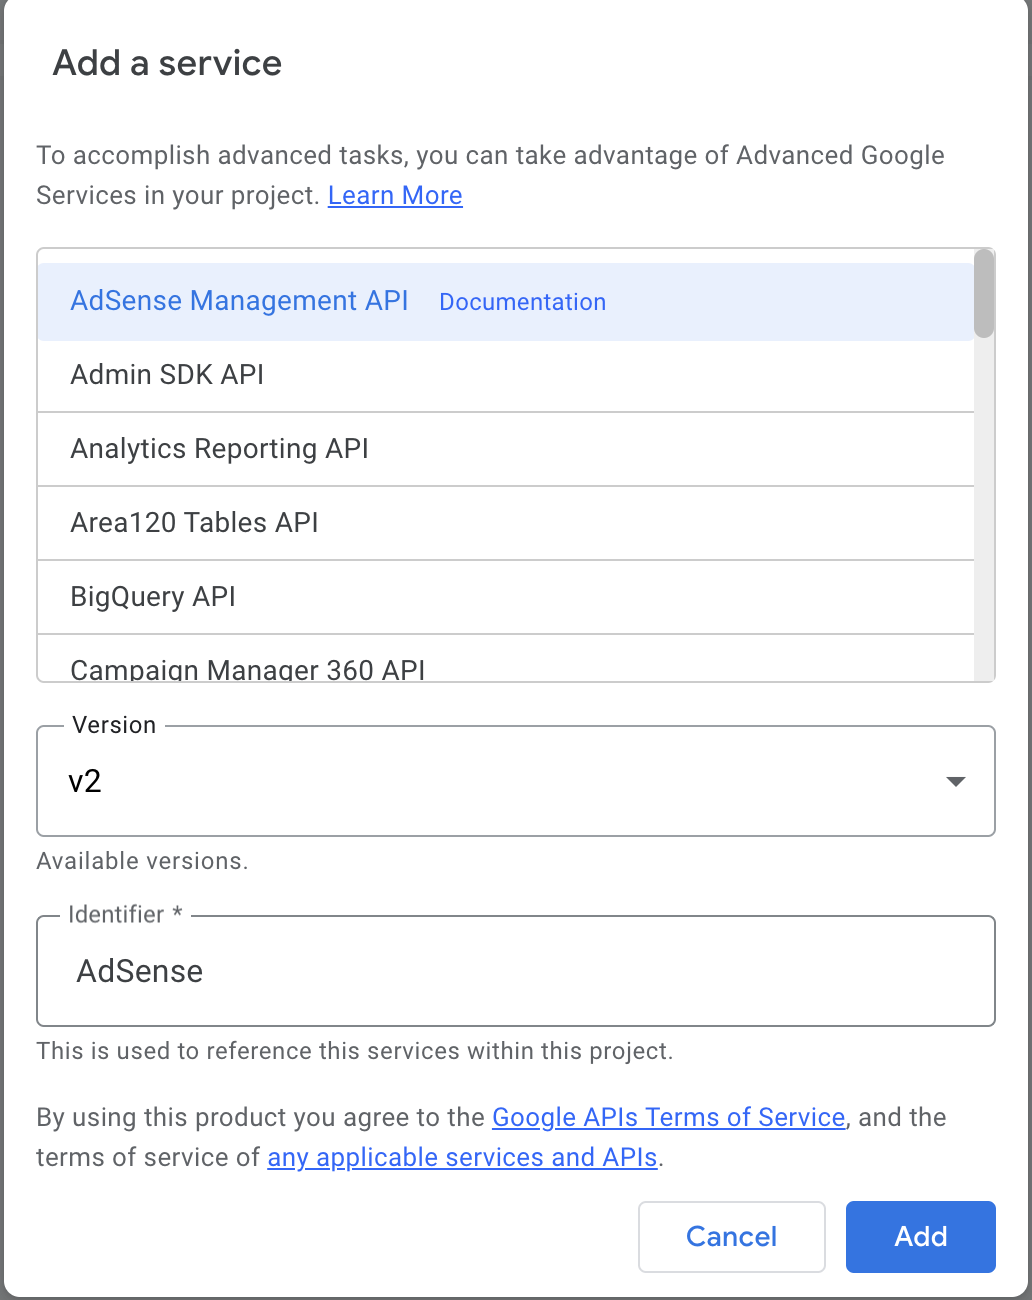
- In the Add a service dialog, select any applicable services and APIs.
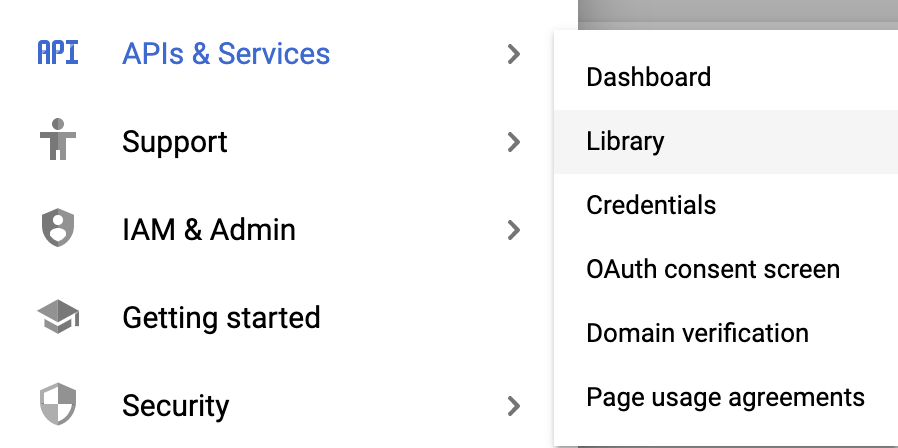
- Go to the Cloud Console and select Navigation menu > APIs & Services > Library.
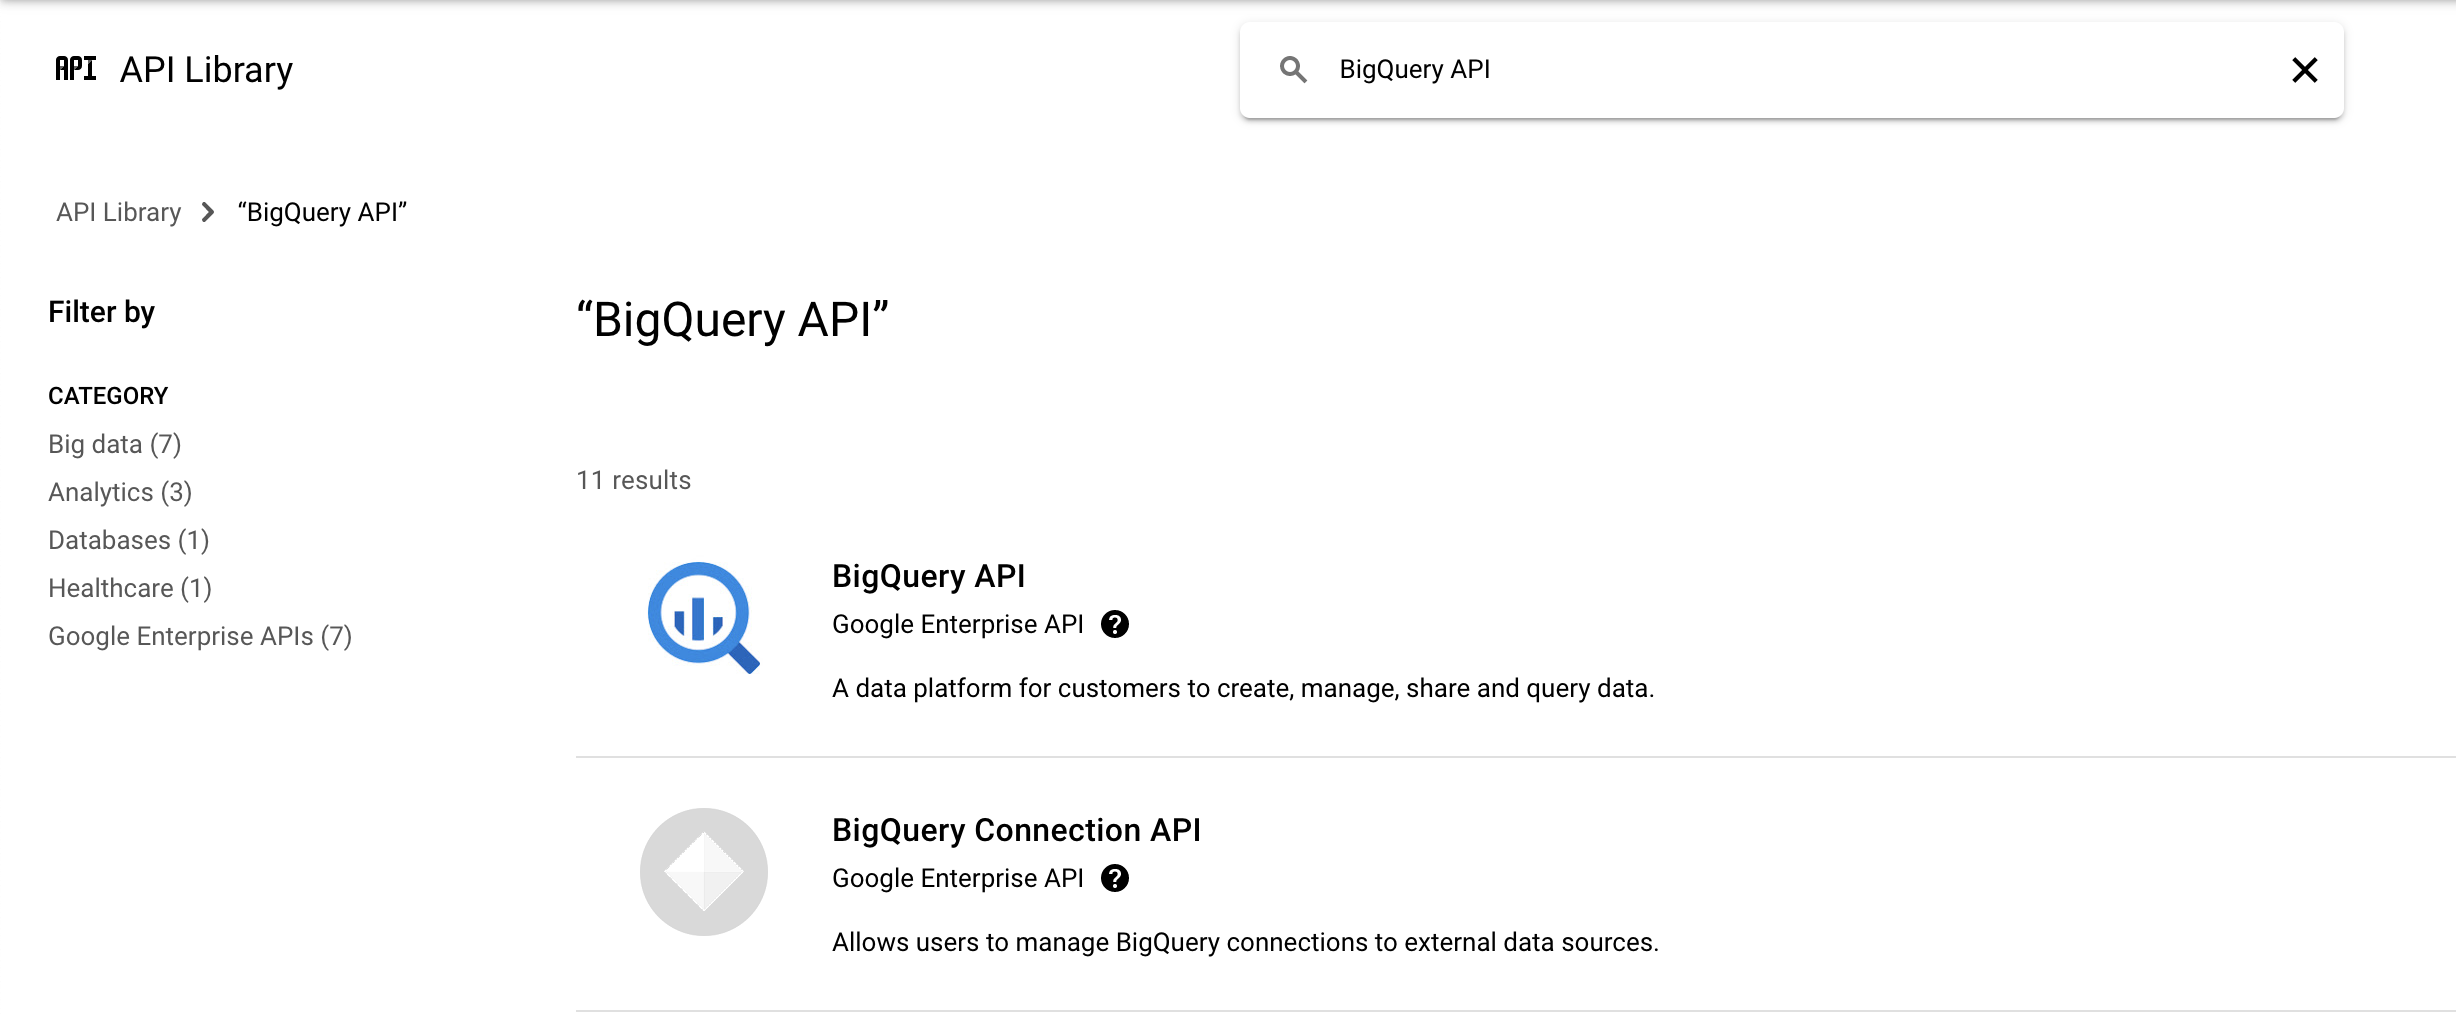
- Type or paste BigQuery API in the search box, then select the BigQuery API.
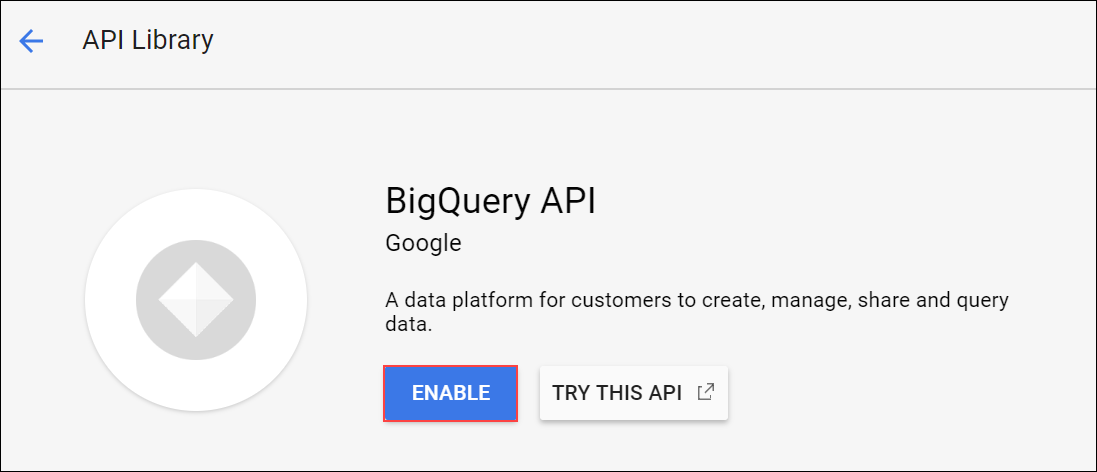
- Click Enable to enable the BigQuery API if required.
-
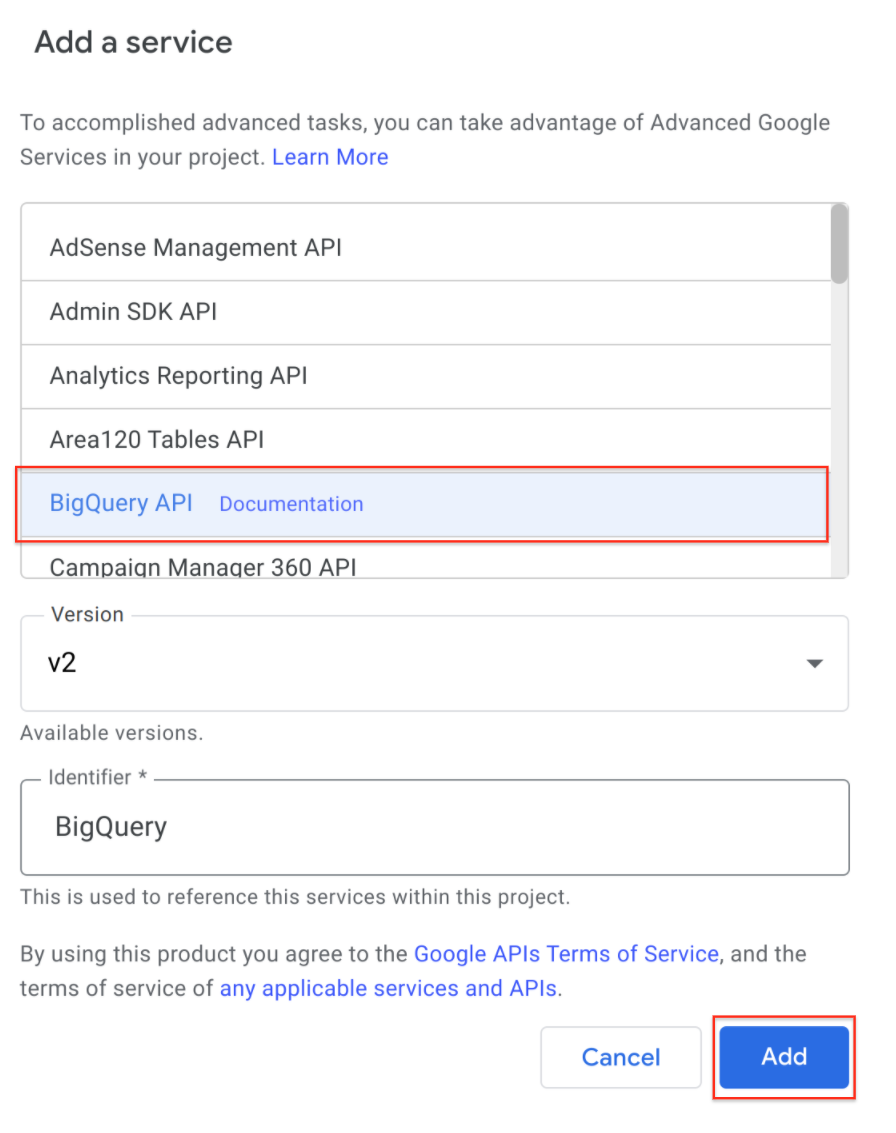
Go back to your project, the Add a services dialog should still be open.
-
Select BigQuery API and click Add to close.
Enter and run your application code
Now you're ready to enter the application code, go through the authorization process, and get the first incarnation of this application working.
- Copy the code in the box below and paste it over everything in the code editor:
/**
* Copyright 2018 Google LLC
*
* Licensed under the Apache License, Version 2.0 (the "License");
* you may not use this file except in compliance with the License.
* You may obtain a copy of the License at apache.org/licenses/LICENSE-2.0.
*
* Unless required by applicable law or agreed to in writing, software
* distributed under the License is distributed on an "AS IS" BASIS,
* WITHOUT WARRANTIES OR CONDITIONS OF ANY KIND, either express or implied.
* See the License for the specific language governing permissions and
* limitations under the License.
*/
// Filename for data results
var QUERY_NAME = "Most common words in all of Shakespeare's works";
// Replace this value with your Google Cloud API project ID
var PROJECT_ID = '<YOUR_PROJECT_ID>';
if (!PROJECT_ID) throw Error('Project ID is required in setup');
/**
* Runs a BigQuery query; puts results into Sheet. You must enable
* the BigQuery advanced service before you can run this code.
* @see http://developers.google.com/apps-script/advanced/bigquery#run_query
* @see http://github.com/gsuitedevs/apps-script-samples/blob/master/advanced/bigquery.gs
*
* @returns {Spreadsheet} Returns a spreadsheet with BigQuery results
* @see http://developers.google.com/apps-script/reference/spreadsheet/spreadsheet
*/
function runQuery() {
// Replace sample with your own BigQuery query.
var request = {
query:
'SELECT ' +
'LOWER(word) AS word, ' +
'SUM(word_count) AS count ' +
'FROM [bigquery-public-data:samples.shakespeare] ' +
'GROUP BY word ' +
'ORDER BY count ' +
'DESC LIMIT 10'
};
var queryResults = BigQuery.Jobs.query(request, PROJECT_ID);
var jobId = queryResults.jobReference.jobId;
// Wait for BQ job completion (with exponential backoff).
var sleepTimeMs = 500;
while (!queryResults.jobComplete) {
Utilities.sleep(sleepTimeMs);
sleepTimeMs *= 2;
queryResults = BigQuery.Jobs.getQueryResults(PROJECT_ID, jobId);
}
// Get all results from BigQuery.
var rows = queryResults.rows;
while (queryResults.pageToken) {
queryResults = BigQuery.Jobs.getQueryResults(PROJECT_ID, jobId, {
pageToken: queryResults.pageToken
});
rows = rows.concat(queryResults.rows);
}
// Return null if no data returned.
if (!rows) {
return Logger.log('No rows returned.');
}
// Create the new results spreadsheet.
var spreadsheet = SpreadsheetApp.create(QUERY_NAME);
var sheet = spreadsheet.getActiveSheet();
// Add headers to Sheet.
var headers = queryResults.schema.fields.map(function(field) {
return field.name.toUpperCase();
});
sheet.appendRow(headers);
// Append the results.
var data = new Array(rows.length);
for (var i = 0; i < rows.length; i++) {
var cols = rows[i].f;
data[i] = new Array(cols.length);
for (var j = 0; j < cols.length; j++) {
data[i][j] = cols[j].v;
}
}
// Start storing data in row 2, col 1
var START_ROW = 2; // skip header row
var START_COL = 1;
sheet.getRange(START_ROW, START_COL, rows.length, headers.length).setValues(data);
Logger.log('Results spreadsheet created: %s', spreadsheet.getUrl());
}
-
Save the file you just created by clicking on Save project icon in the menu bar or by Ctrl + S.
-
Rename the file by clicking the three dots next to the file name and click Rename.
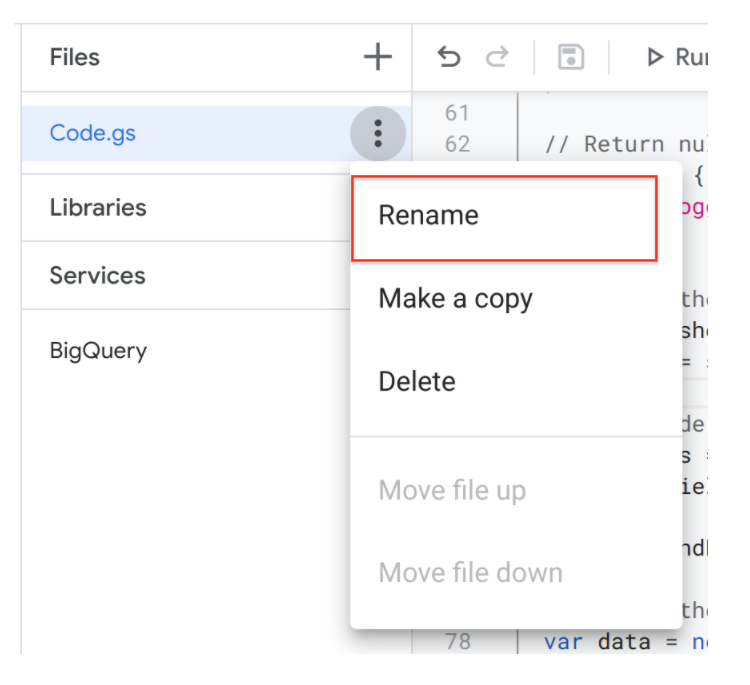
- Change the file name to bq-sheets-slides.gs and press Enter.
So what does this code do? You know that it queries BigQuery and writes the results into a new Google Sheet, but what is this query?
- Look at the query code in the function
runQuery():
SELECT
LOWER(word) AS word,
SUM(word_count) AS count
FROM [bigquery-public-data:samples.shakespeare]
GROUP BY word
ORDER BY count
DESC LIMIT 10
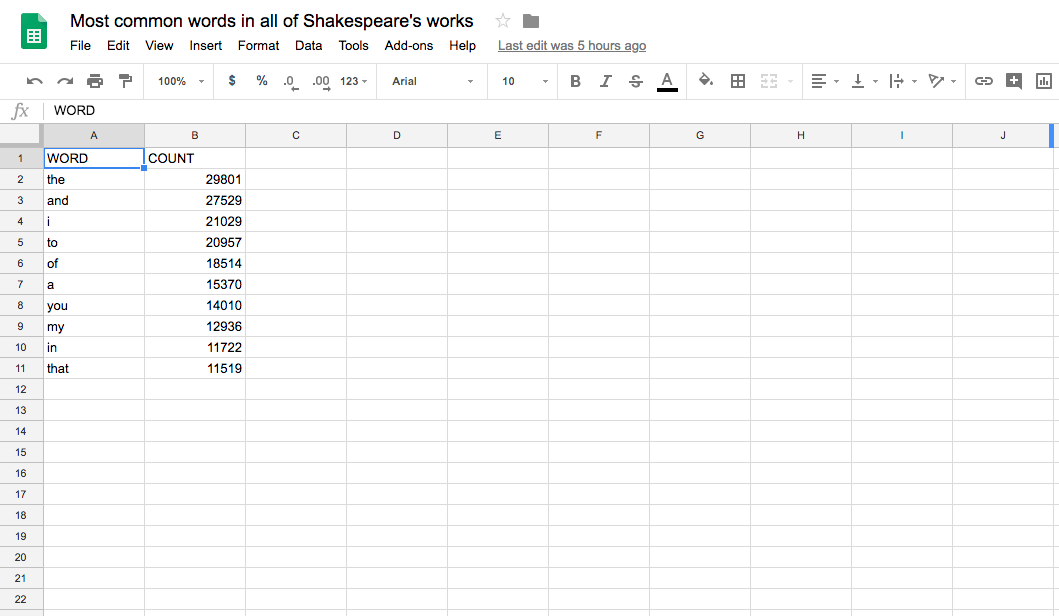
This query looks through Shakespeare's works, part of BigQuery's public data set, and produces the top 10 most frequently-appearing words in all his works, sorted in descending order of popularity. Imagine how (not) fun it would be to do this by hand, and you should have an inkling of an idea of how useful BigQuery is.
Almost there! A valid project ID is required to set the PROJECT_ID variable at the top of bq-sheets-slides.gs.
- Replace
<YOUR_PROJECT_ID> with your Project ID found in the left panel.
Here's an example of the code with an example project id. Your actual PROJECT_ID value will be different.
Example code:
// Filename for data results
var QUERY_NAME = "Most common words in all of Shakespeare's works";
// Replace this value with your Google Cloud API project ID
var PROJECT_ID = '<YOUR_PROJECT_ID>';
if (!PROJECT_ID) throw Error('Project ID is required in setup');
Note: In this code snippet, the if statement is there to prevent the application from going any further without a project ID in place.
Note: If the menu selector gets sticky and inoperable, reload the page.
-
Save the file and run your code by clicking the Run option in the menu bar.
-
Then click Review Permissions.
Note: If you get an error Exception: Service BigQuery API has not been enabled for your Apps.. remove the BigQuery API Service and add it again.
- In the Choose an account from qwiklabs.net dialog, click your Username and then click Allow.
Note: Once you authorize the app you don't need to repeat this process with each execution. It isn't until you get to section "Put the results data into a slide deck" further on in this LAB that you see this dialog screen again, asking for user permission to create and manage Google Slides presentations.
- A small message box opens at the top when the function runs.
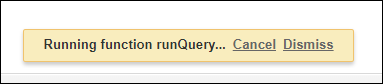
The message box disappears once the function is done, so if you don't see it, the function is probably done running.
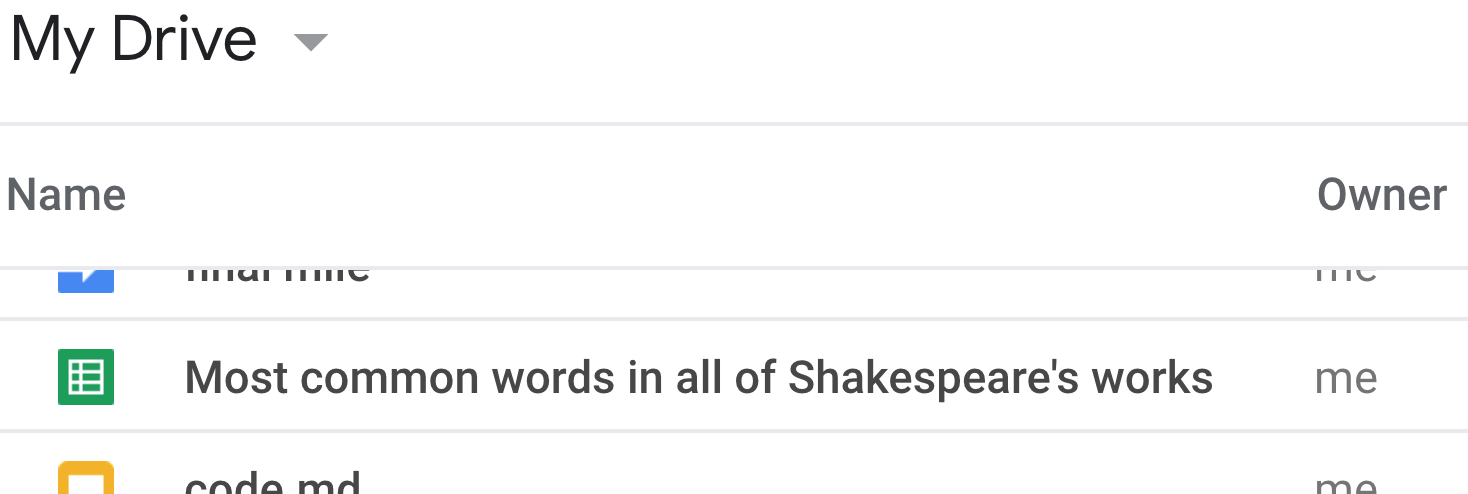
- Go to your Google Drive and look for a new Google Sheet named Most common words in all of Shakespeare's works or the name you have assigned to the
QUERY_NAME variable.
- Open the spreadsheet, and you should see 10 rows of words and their total counts sorted in descending order.
Click Check my progress to verify the objective.
Query BigQuery and log results to Sheet
Summary
So what just happened?! You ran code that queried all of Shakespeare's works (not a HUGE amount of data, but certainly more text than you can easily scan on your own looking at every word in every play, managing a count of such words, then sorting them in descending order of appearances. Not only did you ask BigQuery to do this on your behalf, but you were able to use the built-in service in Apps Script for Google Sheets to organize the data for easy consumption.
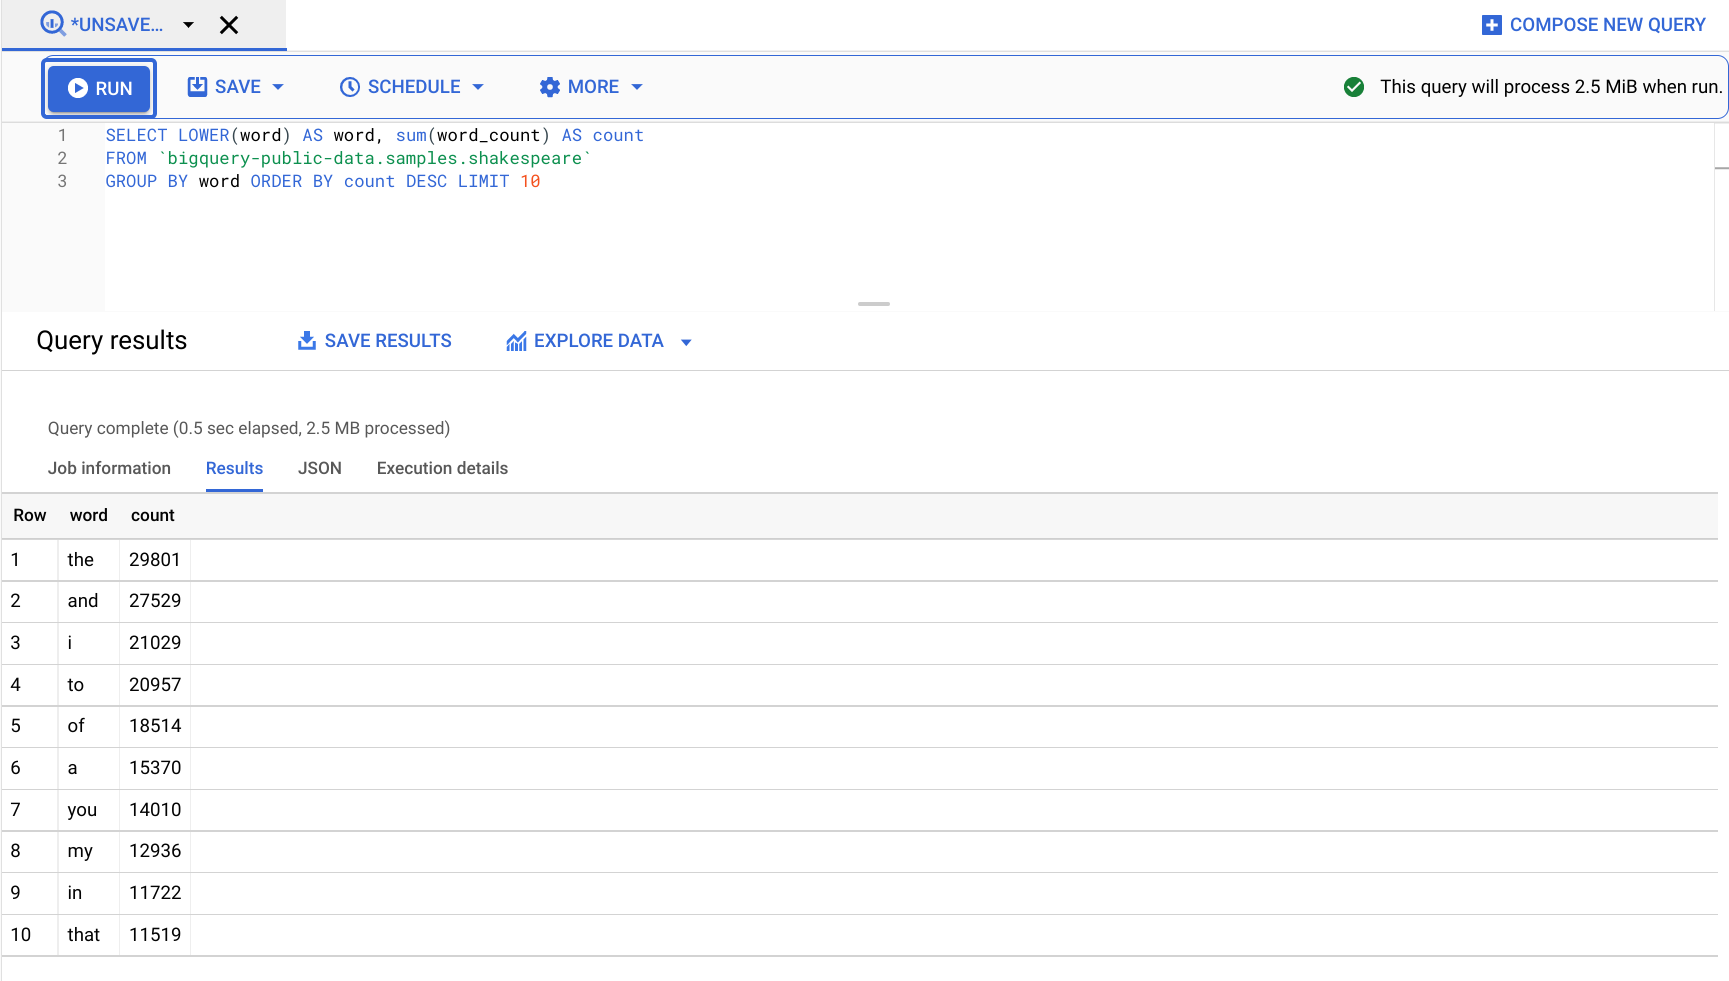
You can always just test the query in the BigQuery console before running it in Apps Script. BigQuery's user interface is available to developers.
- Go to the Cloud Console and Select Navigation menu > BigQuery.
- Click DONE in the Welcome to BigQuery in the Cloud Console dialog.
The BigQuery console opens.
- Enter your code in the Query editor then click Run:
SELECT LOWER(word) AS word, sum(word_count) AS count
FROM `bigquery-public-data.samples.shakespeare`
GROUP BY word ORDER BY count DESC LIMIT 10
Task 2. Create a chart in Google Sheets
Go back in the Script Editor. So far, you've coded an app that queries Shakespeare's works, sorted, then presented the results in Sheets. In the code, the runQuery() function talks to BigQuery and sends its results into a Sheet. Now you'll add code to chart the data. In this section you make a new function called createColumnChart() that calls the Sheet's newChart() method to chart the data.
The createColumnChart()function gets the sheet with data and requests a columnar chart with all the data. The data range starts at cell A2 because the first row contains the column headers, not data.
- Create the chart: Add the
createColumnChart() function to bq-sheets-slides.gs right after runQuery(). {after the last line of code}:
/**
* Uses spreadsheet data to create columnar chart.
* @param {Spreadsheet} Spreadsheet containing results data
* @returns {EmbeddedChart} visualizing the results
* @see http://developers.google.com/apps-script/reference/spreadsheet/embedded-chart
*/
function createColumnChart(spreadsheet) {
// Retrieve the populated (first and only) Sheet.
var sheet = spreadsheet.getSheets()[0];
// Data range in Sheet is from cell A2 to B11
var START_CELL = 'A2'; // skip header row
var END_CELL = 'B11';
// Place chart on Sheet starting on cell E5.
var START_ROW = 5; // row 5
var START_COL = 5; // col E
var OFFSET = 0;
// Create & place chart on the Sheet using above params.
var chart = sheet.newChart()
.setChartType(Charts.ChartType.COLUMN)
.addRange(sheet.getRange(START_CELL + ':' + END_CELL))
.setPosition(START_ROW, START_COL, OFFSET, OFFSET)
.build();
sheet.insertChart(chart);
}
-
Return spreadsheet: In the above code, createColumnChart() needs the spreadsheet object, so tweak app to return spreadsheet object so it can pass it to createColumnChart(). After logging the successful creation of the Google Sheet, return the object at the end of runQuery().
-
Replace the last line (starts with Logger.log) with the following:
Logger.log('Results spreadsheet created: %s', spreadsheet.getUrl());
// Return the spreadsheet object for later use.
return spreadsheet;
}
- Drive
createBigQueryPresentation() function: Logically segregating the BigQuery and chart-creation functionality is a great idea. Create a createBigQueryPresentation() function to drive the app, calling both and createColumnChart(). The code you add should look like this:
/**
* Runs a BigQuery query, adds data and a chart in a Sheet.
*/
function createBigQueryPresentation() {
var spreadsheet = runQuery();
createColumnChart(spreadsheet);
}
- Put the
createBigQueryPresentation() function right after this code block:
// Filename for data results
var QUERY_NAME = "Most common words in all of Shakespeare's works";
// Replace this value with your Google Cloud API project ID
var PROJECT_ID = '<YOUR_PROJECT_ID>';
if (!PROJECT_ID) throw Error('Project ID is required in setup');
- Make code more reusable: You took 2 important steps above: returned the spreadsheet object and created a driving function. What if a colleague wanted to reuse
runQuery() and doesn't want the URL logged?
To make runQuery() more digestible for general use, move that log line. The best place to move it? If you guessed createBigQueryPresentation(), you'd be correct!
After moving the log line, it should look like this:
/**
* Runs a BigQuery query, adds data and a chart in a Sheet.
*/
function createBigQueryPresentation() {
var spreadsheet = runQuery();
Logger.log('Results spreadsheet created: %s', spreadsheet.getUrl());
createColumnChart(spreadsheet);
}
With the changes above, your bq-sheets-slides.js should now look like the following (except for PROJECT_ID):
/**
* Copyright 2018 Google LLC
*
* Licensed under the Apache License, Version 2.0 (the "License");
* you may not use this file except in compliance with the License.
* You may obtain a copy of the License at apache.org/licenses/LICENSE-2.0.
*
* Unless required by applicable law or agreed to in writing, software
* distributed under the License is distributed on an "AS IS" BASIS,
* WITHOUT WARRANTIES OR CONDITIONS OF ANY KIND, either express or implied.
* See the License for the specific language governing permissions and
* limitations under the License.
*/
// Filename for data results
var QUERY_NAME = "Most common words in all of Shakespeare's works";
// Replace this value with your Google Cloud API project ID
var PROJECT_ID = '<YOUR_PROJECT_ID>';
if (!PROJECT_ID) throw Error('Project ID is required in setup');
/**
* Runs a BigQuery query, adds data and a chart in a Sheet.
*/
function createBigQueryPresentation() {
var spreadsheet = runQuery();
Logger.log('Results spreadsheet created: %s', spreadsheet.getUrl());
createColumnChart(spreadsheet);
}
/**
* Runs a BigQuery query; puts results into Sheet. You must enable
* the BigQuery advanced service before you can run this code.
* @see http://developers.google.com/apps-script/advanced/bigquery#run_query
* @see http://github.com/gsuitedevs/apps-script-samples/blob/master/advanced/bigquery.gs
*
* @returns {Spreadsheet} Returns a spreadsheet with BigQuery results
* @see http://developers.google.com/apps-script/reference/spreadsheet/spreadsheet
*/
function runQuery() {
// Replace sample with your own BigQuery query.
var request = {
query:
'SELECT ' +
'LOWER(word) AS word, ' +
'SUM(word_count) AS count ' +
'FROM [bigquery-public-data:samples.shakespeare] ' +
'GROUP BY word ' +
'ORDER BY count ' +
'DESC LIMIT 10'
};
var queryResults = BigQuery.Jobs.query(request, PROJECT_ID);
var jobId = queryResults.jobReference.jobId;
// Wait for BQ job completion (with exponential backoff).
var sleepTimeMs = 500;
while (!queryResults.jobComplete) {
Utilities.sleep(sleepTimeMs);
sleepTimeMs *= 2;
queryResults = BigQuery.Jobs.getQueryResults(PROJECT_ID, jobId);
}
// Get all results from BigQuery.
var rows = queryResults.rows;
while (queryResults.pageToken) {
queryResults = BigQuery.Jobs.getQueryResults(PROJECT_ID, jobId, {
pageToken: queryResults.pageToken
});
rows = rows.concat(queryResults.rows);
}
// Return null if no data returned.
if (!rows) {
return Logger.log('No rows returned.');
}
// Create the new results spreadsheet.
var spreadsheet = SpreadsheetApp.create(QUERY_NAME);
var sheet = spreadsheet.getActiveSheet();
// Add headers to Sheet.
var headers = queryResults.schema.fields.map(function(field) {
return field.name.toUpperCase();
});
sheet.appendRow(headers);
// Append the results.
var data = new Array(rows.length);
for (var i = 0; i < rows.length; i++) {
var cols = rows[i].f;
data[i] = new Array(cols.length);
for (var j = 0; j < cols.length; j++) {
data[i][j] = cols[j].v;
}
}
// Start storing data in row 2, col 1
var START_ROW = 2; // skip header row
var START_COL = 1;
sheet.getRange(START_ROW, START_COL, rows.length, headers.length).setValues(data);
Logger.log('Results spreadsheet created: %s', spreadsheet.getUrl());
// Return the spreadsheet object for later use.
return spreadsheet;
}
/**
* Uses spreadsheet data to create columnar chart.
* @param {Spreadsheet} Spreadsheet containing results data
* @returns {EmbeddedChart} visualizing the results
* @see http://developers.google.com/apps-script/reference/spreadsheet/embedded-chart
*/
function createColumnChart(spreadsheet) {
// Retrieve the populated (first and only) Sheet.
var sheet = spreadsheet.getSheets()[0];
// Data range in Sheet is from cell A2 to B11
var START_CELL = 'A2'; // skip header row
var END_CELL = 'B11';
// Place chart on Sheet starting on cell E5.
var START_ROW = 5; // row 5
var START_COL = 5; // col E
var OFFSET = 0;
// Create & place chart on the Sheet using above params.
var chart = sheet.newChart()
.setChartType(Charts.ChartType.COLUMN)
.addRange(sheet.getRange(START_CELL + ':' + END_CELL))
.setPosition(START_ROW, START_COL, OFFSET, OFFSET)
.build();
sheet.insertChart(chart);
}
-
Save the file.
-
Then in the menu bar, click on runQuery and select createBigQueryPresentation from the dropdown.
-
Then click Run.
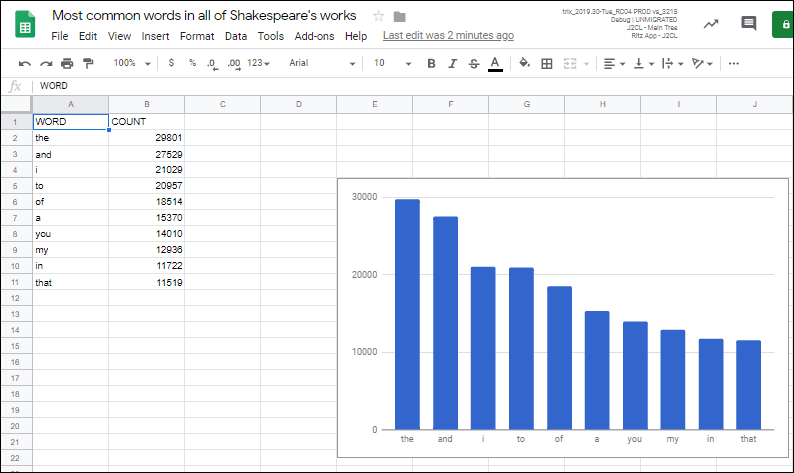
After running it, you'll get another Google Sheet in your Google Drive, but this time, a chart shows up in the Sheet next to the data:
Task 3. Put the results data into a slide deck
The final part of the lab involves creating a new Google Slides presentation, filling the title and subtitle on the title slide, then adding 2 new slides, one for each of the data cells and another for the chart.
- Create slide deck: Start with the creation of a new slide deck, then add a title and subtitle to the default title slide you get with all new presentations. All of the work on the slide deck takes place in the
createSlidePresentation() function, which you add to bq-sheets-slides.gs right after the createColumnChart()function code:
/**
* Create presentation with spreadsheet data & chart
* @param {Spreadsheet} Spreadsheet with results data
* @param {EmbeddedChart} Sheets chart to embed on slide
* @returns {Presentation} Slide deck with results
*/
function createSlidePresentation(spreadsheet, chart) {
// Create the new presentation.
var deck = SlidesApp.create(QUERY_NAME);
// Populate the title slide.
var [title, subtitle] = deck.getSlides()[0].getPageElements();
title.asShape().getText().setText(QUERY_NAME);
subtitle.asShape().getText().setText('via GCP and G Suite APIs:\n' +
'Google Apps Script, BigQuery, Sheets, Slides');
- Add data table: The next step in
createSlidePresentation() is to import the cell data from the Google Sheet into our new slide deck. Add this code snippet to the createSlidePresentation()function:
// Data range to copy is from cell A1 to B11
var START_CELL = 'A1'; // include header row
var END_CELL = 'B11';
// Add the table slide and insert an empty table on it of
// the dimensions of the data range; fails if Sheet empty.
var tableSlide = deck.appendSlide(SlidesApp.PredefinedLayout.BLANK);
var sheetValues = spreadsheet.getSheets()[0].getRange(
START_CELL + ':' + END_CELL).getValues();
var table = tableSlide.insertTable(sheetValues.length, sheetValues[0].length);
// Populate the table with spreadsheet data.
for (var i = 0; i < sheetValues.length; i++) {
for (var j = 0; j < sheetValues[0].length; j++) {
table.getCell(i, j).getText().setText(String(sheetValues[i][j]));
}
}
- Import chart: The final step in
createSlidePresentation() is to create one more slide, import the chart from our spreadsheet, and return the Presentation object. Add this final snippet to the function:
// Add a chart slide and insert the chart on it.
var chartSlide = deck.appendSlide(SlidesApp.PredefinedLayout.BLANK);
chartSlide.insertSheetsChart(chart);
// Return the presentation object for later use.
return deck;
}
- Return chart: Now that our final function is complete, take another look at its signature. Yes,
createSlidePresentation() requires both a spreadsheet and a chart object. You've already adjusted runQuery() to return the Spreadsheet object but now you need to make a similar change to createColumnChart() to return the chart (EmbeddedChart) object. Do that by going back in your application and add one last line at the end of createColumnChart():
// Return chart object for later use
return chart;
}
- Update
createBigQueryPresentation(): Since createColumnChart() returns the chart, you need to save that chart to a variable then pass both the spreadsheet and the chart to createSlidePresentation(). Since you log the URL of the newly-created spreadsheet, you can also log the URL of the new slide presentation. Replace this code block:
/**
* Runs a BigQuery query, adds data and a chart in a Sheet.
*/
function createBigQueryPresentation() {
var spreadsheet = runQuery();
Logger.log('Results spreadsheet created: %s', spreadsheet.getUrl());
createColumnChart(spreadsheet);
}
With this:
/**
* Runs a BigQuery query, adds data and a chart in a Sheet,
* and adds the data and chart to a new slide presentation.
*/
function createBigQueryPresentation() {
var spreadsheet = runQuery();
Logger.log('Results spreadsheet created: %s', spreadsheet.getUrl());
var chart = createColumnChart(spreadsheet);
var deck = createSlidePresentation(spreadsheet, chart);
Logger.log('Results slide deck created: %s', deck.getUrl());
}
After all updates, your bq-sheets-slides.gs should now look like this, except for the PROJECT_ID:
bq-sheets-slides.gs - final version
// Filename for data results
var QUERY_NAME = "Most common words in all of Shakespeare's works";
// Replace this value with your Google Cloud API project ID
var PROJECT_ID = '<YOUR_PROJECT_ID>';
if (!PROJECT_ID) throw Error('Project ID is required in setup');
/**
* Runs a BigQuery query; puts results into Sheet. You must enable
* the BigQuery advanced service before you can run this code.
* @see http://developers.google.com/apps-script/advanced/bigquery#run_query
* @see http://github.com/gsuitedevs/apps-script-samples/blob/master/advanced/bigquery.gs
*
* @returns {Spreadsheet} Returns a spreadsheet with BigQuery results
* @see http://developers.google.com/apps-script/reference/spreadsheet/spreadsheet
*/
function runQuery() {
// Replace sample with your own BigQuery query.
var request = {
query:
'SELECT ' +
'LOWER(word) AS word, ' +
'SUM(word_count) AS count ' +
'FROM [bigquery-public-data:samples.shakespeare] ' +
'GROUP BY word ' +
'ORDER BY count ' +
'DESC LIMIT 10'
};
var queryResults = BigQuery.Jobs.query(request, PROJECT_ID);
var jobId = queryResults.jobReference.jobId;
// Wait for BQ job completion (with exponential backoff).
var sleepTimeMs = 500;
while (!queryResults.jobComplete) {
Utilities.sleep(sleepTimeMs);
sleepTimeMs *= 2;
queryResults = BigQuery.Jobs.getQueryResults(PROJECT_ID, jobId);
}
// Get all results from BigQuery.
var rows = queryResults.rows;
while (queryResults.pageToken) {
queryResults = BigQuery.Jobs.getQueryResults(PROJECT_ID, jobId, {
pageToken: queryResults.pageToken
});
rows = rows.concat(queryResults.rows);
}
// Return null if no data returned.
if (!rows) {
return Logger.log('No rows returned.');
}
// Create the new results spreadsheet.
var spreadsheet = SpreadsheetApp.create(QUERY_NAME);
var sheet = spreadsheet.getActiveSheet();
// Add headers to Sheet.
var headers = queryResults.schema.fields.map(function(field) {
return field.name.toUpperCase();
});
sheet.appendRow(headers);
// Append the results.
var data = new Array(rows.length);
for (var i = 0; i < rows.length; i++) {
var cols = rows[i].f;
data[i] = new Array(cols.length);
for (var j = 0; j < cols.length; j++) {
data[i][j] = cols[j].v;
}
}
// Start storing data in row 2, col 1
var START_ROW = 2; // skip header row
var START_COL = 1;
sheet.getRange(START_ROW, START_COL, rows.length, headers.length).setValues(data);
// Return the spreadsheet object for later use.
return spreadsheet;
}
/**
* Uses spreadsheet data to create columnar chart.
* @param {Spreadsheet} Spreadsheet containing results data
* @returns {EmbeddedChart} visualizing the results
* @see http://developers.google.com/apps-script/reference/spreadsheet/embedded-chart
*/
function createColumnChart(spreadsheet) {
// Retrieve the populated (first and only) Sheet.
var sheet = spreadsheet.getSheets()[0];
// Data range in Sheet is from cell A2 to B11
var START_CELL = 'A2'; // skip header row
var END_CELL = 'B11';
// Place chart on Sheet starting on cell E5.
var START_ROW = 5; // row 5
var START_COL = 5; // col E
var OFFSET = 0;
// Create & place chart on the Sheet using above params.
var chart = sheet.newChart()
.setChartType(Charts.ChartType.COLUMN)
.addRange(sheet.getRange(START_CELL + ':' + END_CELL))
.setPosition(START_ROW, START_COL, OFFSET, OFFSET)
.build();
sheet.insertChart(chart);
// Return the chart object for later use.
return chart;
}
/**
* Create presentation with spreadsheet data & chart
* @param {Spreadsheet} Spreadsheet with results data
* @param {EmbeddedChart} Sheets chart to embed on slide
* @returns {Presentation} Returns a slide deck with results
* @see http://developers.google.com/apps-script/reference/slides/presentation
*/
function createSlidePresentation(spreadsheet, chart) {
// Create the new presentation.
var deck = SlidesApp.create(QUERY_NAME);
// Populate the title slide.
var [title, subtitle] = deck.getSlides()[0].getPageElements();
title.asShape().getText().setText(QUERY_NAME);
subtitle.asShape().getText().setText('via GCP and G Suite APIs:\n' +
'Google Apps Script, BigQuery, Sheets, Slides');
// Data range to copy is from cell A1 to B11
var START_CELL = 'A1'; // include header row
var END_CELL = 'B11';
// Add the table slide and insert an empty table on it of
// the dimensions of the data range; fails if Sheet empty.
var tableSlide = deck.appendSlide(SlidesApp.PredefinedLayout.BLANK);
var sheetValues = spreadsheet.getSheets()[0].getRange(
START_CELL + ':' + END_CELL).getValues();
var table = tableSlide.insertTable(sheetValues.length, sheetValues[0].length);
// Populate the table with spreadsheet data.
for (var i = 0; i < sheetValues.length; i++) {
for (var j = 0; j < sheetValues[0].length; j++) {
table.getCell(i, j).getText().setText(String(sheetValues[i][j]));
}
}
// Add a chart slide and insert the chart on it.
var chartSlide = deck.appendSlide(SlidesApp.PredefinedLayout.BLANK);
chartSlide.insertSheetsChart(chart);
// Return the presentation object for later use.
return deck;
}
/**
* Runs a BigQuery query, adds data and a chart in a Sheet,
* and adds the data and chart to a new slide presentation.
*/
function createBigQueryPresentation() {
var spreadsheet = runQuery();
Logger.log('Results spreadsheet created: %s', spreadsheet.getUrl());
var chart = createColumnChart(spreadsheet);
var deck = createSlidePresentation(spreadsheet, chart);
Logger.log('Results slide deck created: %s', deck.getUrl());
}
- Save and run
createBigQueryPresentation() again. Before it executes, you'll be prompted for one more set of permissions to view and manage your Google Slides presentations.
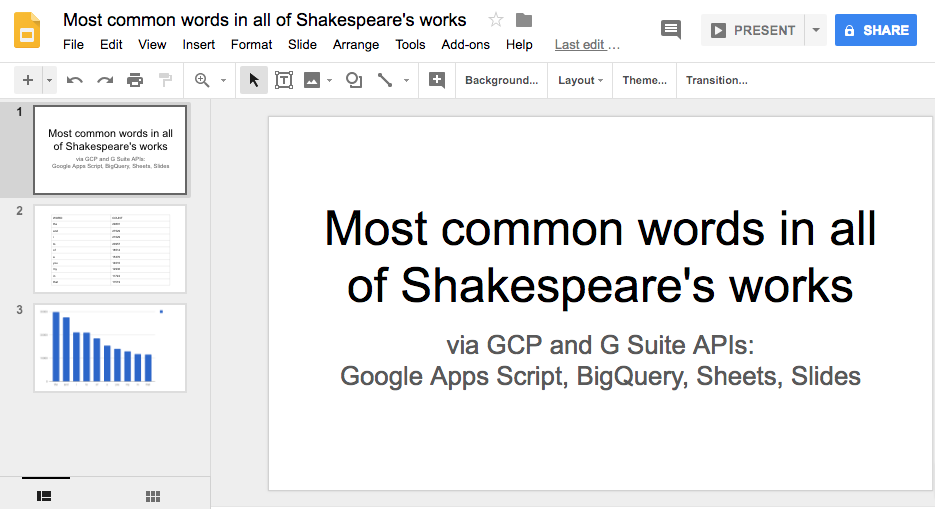
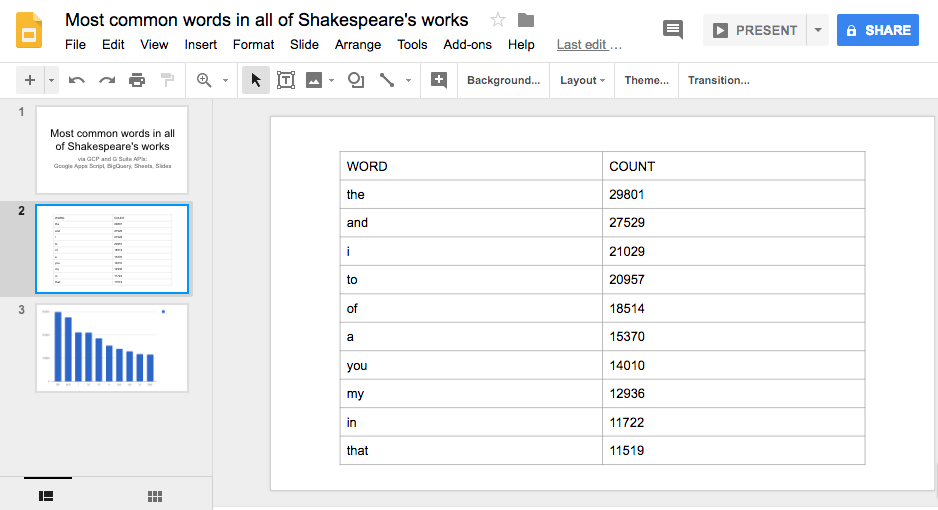
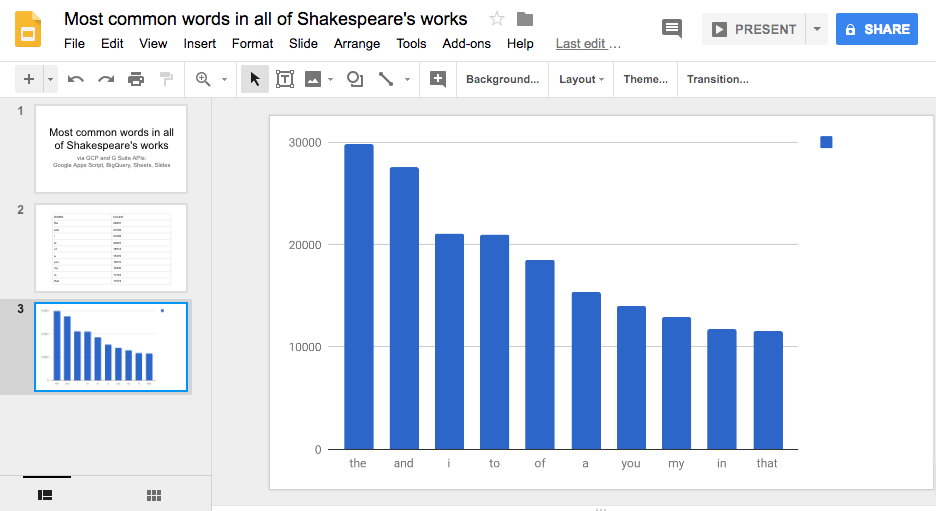
- Go to your My Drive and see that in addition to the Sheet that's created, you should also see a new Slides presentation with 3 slides (title, data table, data chart), as shown below:
Congratulations!
You've now created an application that leverages both sides of Google Cloud by performing a BigQuery request that queries one of its public data sets, creates a new Google Sheet to store the results, add a chart based on the retrieved data, and finally create a Google Slides presentation featuring the results as well as chart in the spreadsheet.
That's what you did technically. Broadly speaking, you went from a big data analysis to something you can present to stakeholders, all in code, all automated. Now you can take this lab and customize it for your own projects.
Finish your quest
This self-paced lab is part of the Workspace: Integrations for Data and BigQuery Basics for Data Analysts quests. A quest is a series of related labs that form a learning path. Completing a quest earns you a badge to recognize your achievement. You can make your badge or badges public and link to them in your online resume or social media account. Enroll in any quest that contains this lab and get immediate completion credit. See the Google Cloud Skills Boost catalog to see all available quests.
Looking for a hands-on challenge lab to demonstrate your BigQuery skills and validate your knowledge? On completing this quest, finish this additional challenge lab to receive an exclusive Google Cloud digital badge.
Learn more
The code featured in this lab is also available in GitHub. The lab tries to stay in-sync with the repo. Below are additional resources to help you dig deeper into the material covered in this lab and explore other ways of accessing Google developer tools programmatically.
Documentation
Related and general videos
Related and general news & updates
Manual Last Updated March 06, 2023
Lab Last Tested March 06, 2023
Copyright 2024 Google LLC All rights reserved. Google and the Google logo are trademarks of Google LLC. All other company and product names may be trademarks of the respective companies with which they are associated.